
 Video analytics allow instructors to track the use of videos and media, how well they’re working, who is watching or viewing the media, and which parts of a video are attracting the most attention.
User data quickly highlights which students or groups of students may be struggling, and allows them to address those students’ needs.
The effective use of analytics can enable:
- Improved student outcomes. Numbers and statistics can help determine the best course of action for an instructor, whether a certain concept needs to be retaught, or a certain student is struggling overall, a detailed report can show instructors where to put their efforts.
- Higher quality instruction. Near real-time feedback can help instructors augment their learning based on student feedback.
- Enhanced responsiveness to student needs and desires. By identifying challenges as they occur, instructors can intervene before it causes a student to fail.
Analytics for Course Insights
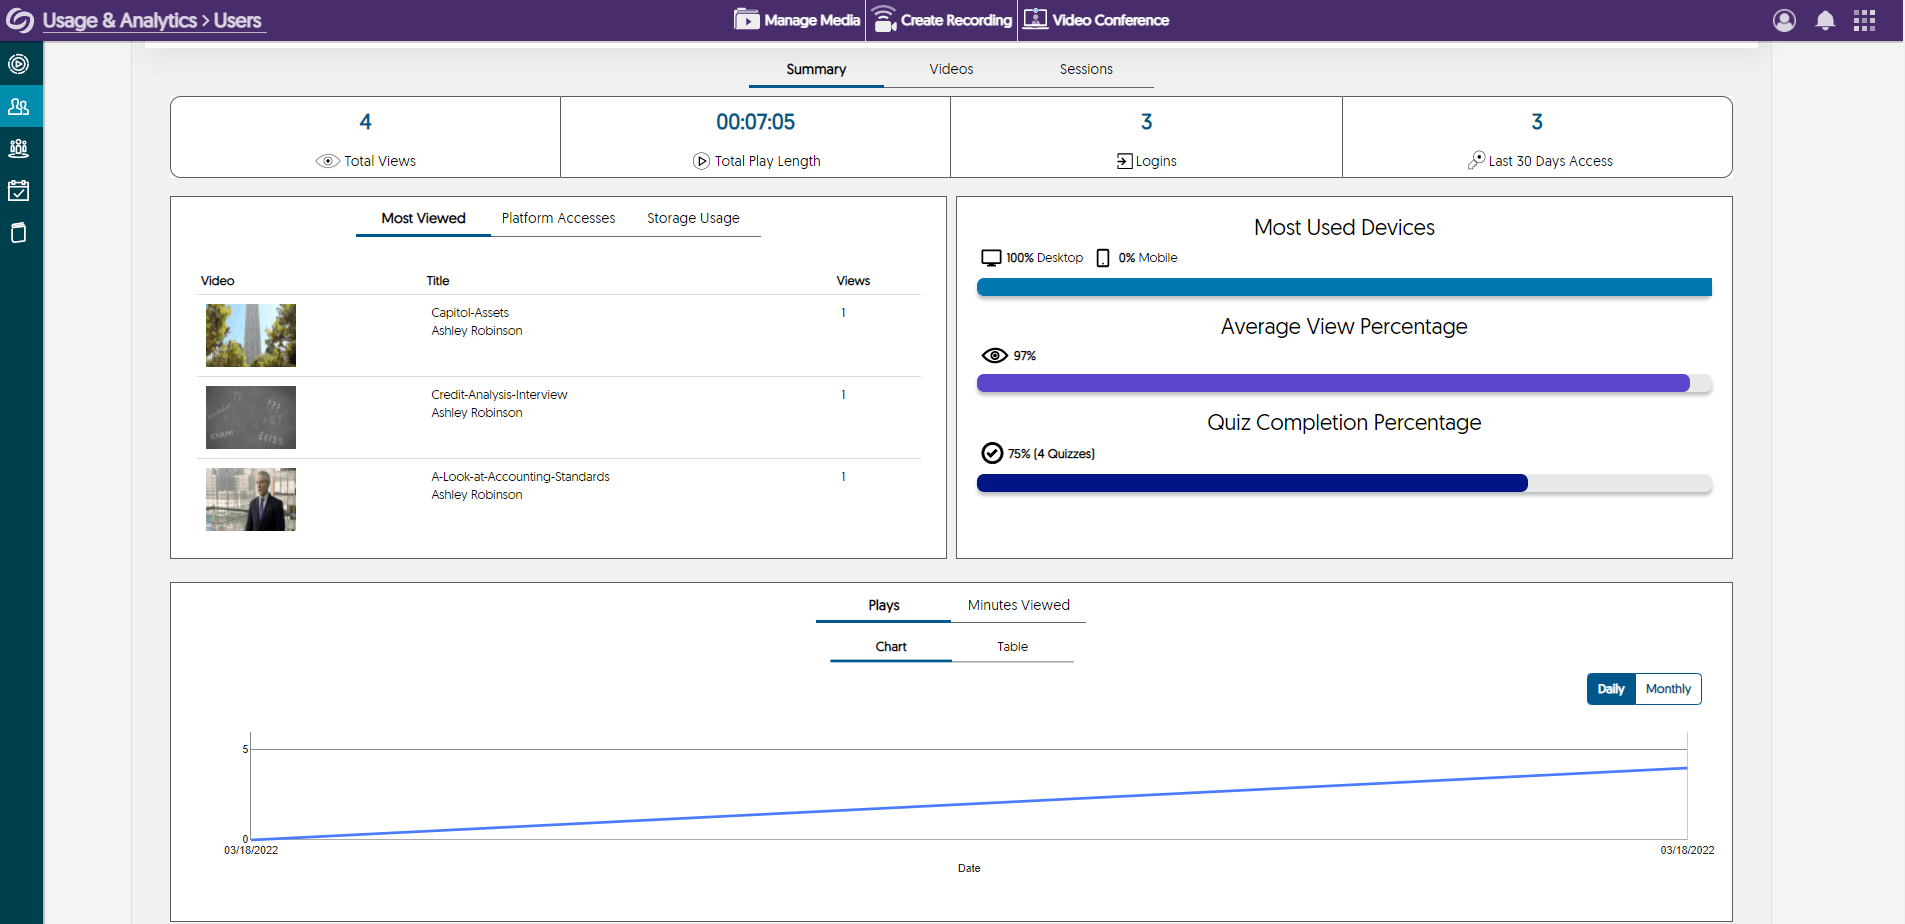
With a comprehensive Visual Analytics dashboard, instructors and administrators can view:
- The number of videos and quizzes viewed
- Total play length
- Engagement metrics
- A usage summary
Using the data, instructors can understand their classes at both a class and individual student level, including their participation, collaboration and where students might be struggling to understand a concept.
Analytics Drive Actionable Insights
The YuJa Enterprise Video Platform offers a variety of analytics tools that provide a comprehensive picture of instruction, course success, student understanding and more.
“The YuJa Enterprise Video Platform offers a variety of analytics tools that provide a comprehensive picture of instruction, course success, student understanding and more.”
- Comprehensive Insights: Review total storage, total bandwidth, most active classes, and top videos on a single page.
- Content Analytics: With Content Analytics, instructors can look at a range of information about individual media files and user interactions with those files, including an overall summary and specific information about views, browsers, operating systems, and a segment-by-segment breakdown of media content viewing patterns.
- User Analytics: Analytics on a user level provide useful information about how a specific user is engaging with content published to Media Channels and Deep Linked Content for an individual class or group.
- Group Analytics: Group Analytics provides information about historical cumulative views and historical cumulative unique views, along with the most popular videos and media content.
- Visits Page: YuJa offers a Visits page, which reviews information about unique and non-unique users in the institution or enterprise and about registered devices. Administrators can quickly see organizational data, rather than information about a single class or media recording.
- Storage Analytics: Storage tracks the use of storage in the YuJa Cloud, with both storage usage and the number of stored objects.
- Bandwidth: Tracks bandwidth usage, either overall or on a class-by-class basis.
- Gradebook Analytics: The Grade Book provides access to quiz scores.