
Web and App Accessibility: Understanding the U.S. Justice Department’s Proposed Rulemaking
Download the PDF >
Boost Video Accessibility with the GenAI Video PowerPack!
Try NowSupercharge Your Compliance Efforts with AutoPilot Remediation Max!
Try NowStrengthen Your PDF Accessibility Efforts with Structural Remediation Max!
Try NowDon't Miss Any of Our Upcoming Webinars—Save Your Spot!
RegisterThe YuJa Community is here! Connect, get updates, and access exclusive content.
Join NowThe Video Analytics suite provides insights on viewership, usage, and engagement that help content creators gain a deep understanding of how their media impacts their audience.
Scrolling logos of YuJa’s clients such as SUNY Corning, University of Cambridge and University of Calgary, etc.
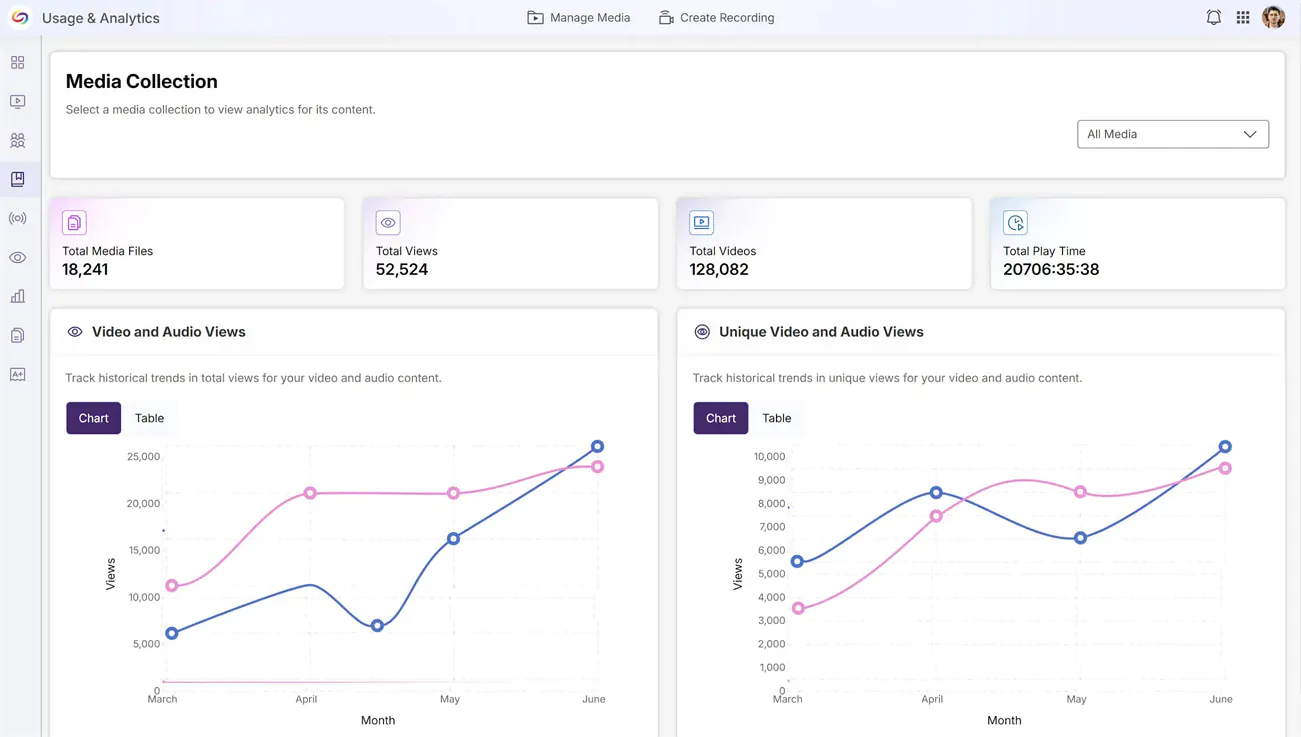
Use the YuJa Lumina Video Platform’s Visual Analytics suite to collect a wide variety of data that can be converted into reports covering video performance, system statistics, and resource usage. Get insight into the minds’ of your viewers with historical data charts for all your videos, providing you with actionable details about what works with your audience.
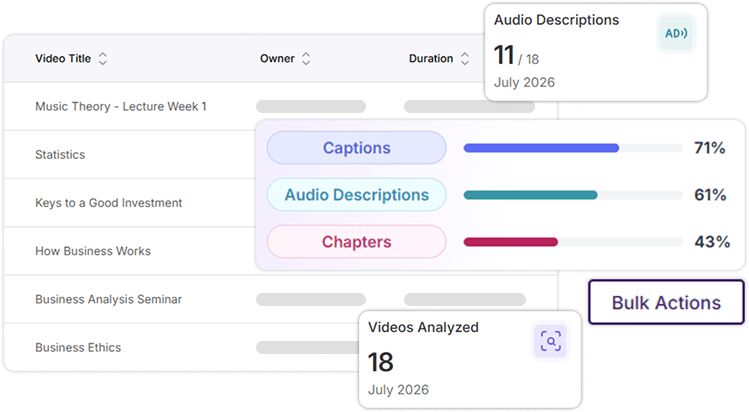
Access a comprehensive Video Compliance Report that provides quality indicators on video captions, audio descriptions, and chapters. Leverage configurable institutional scopes, compliance summaries, bulk auto-caption requests, and built-in remediation workflows to effortlessly boost the accessibility of your videos.
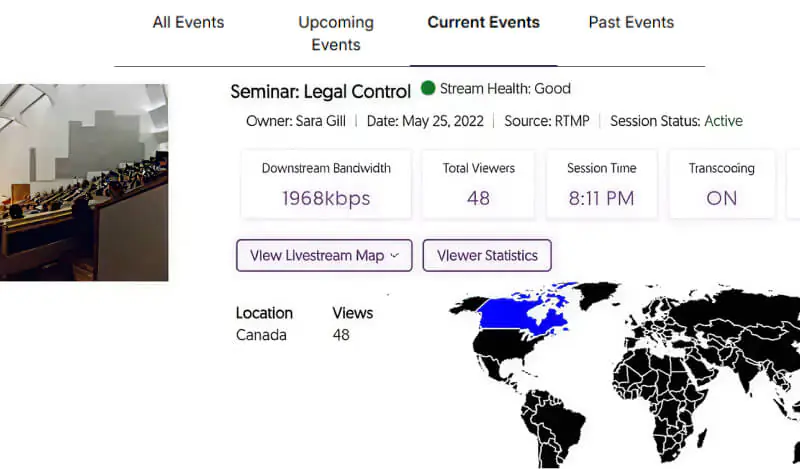
Real-time statistics are available for live streams initiated in Hardware Hub, Software Capture, and RTMP. Get instant access to knowledge about your live streams, including real-time stream quality, downstream bandwidth, and viewer statistics.
YuJa’s Video Analytics dissects bulk information and reflects it in specialized dashboards. By providing customized dashboards, the interface reduces information clutter and provides your stakeholders with only the most necessary information.
![]()
Overview dashboards provide key statistics and analytics in an easy-to-use panel.
![]()
Content dashboards track total stored videos, utilization and “hotspots”.
![]()
Course-level dashboards provide instructor’s insight on specific courses.
![]()
User dashboards allow instructors to review user-level analytics and usage.


“Transitioning to YuJa was easy and smooth. The account representatives helped every step of the way.”
Learn More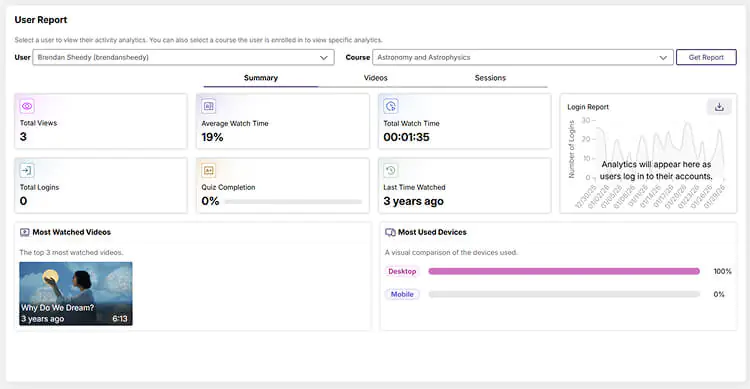
Instructors and administrators can easily track individual student performance at both the course and institution level. With continuously updating reports, instructors can identify and help at-risk students.

Our Visual Analytics suite enables instructors to conduct rigorous analysis on a video’s performance. Receive actionable insights on how to improve your institutions video assets by tracking student engagement, views, and areas of confusion.
Join the 1,000+ Organizations Deploying High-Impact Solutions