


Web and App Accessibility: Understanding the U.S. Justice Department’s Proposed Rulemaking
Download the PDF >
Boost Video Accessibility with the GenAI Video PowerPack!
Try NowSupercharge Your Compliance Efforts with AutoPilot Remediation Max!
Try NowStrengthen Your PDF Accessibility Efforts with Structural Remediation Max!
Try NowDon't Miss Any of Our Upcoming Webinars—Save Your Spot!
RegisterThe YuJa Community is here! Connect, get updates, and access exclusive content.
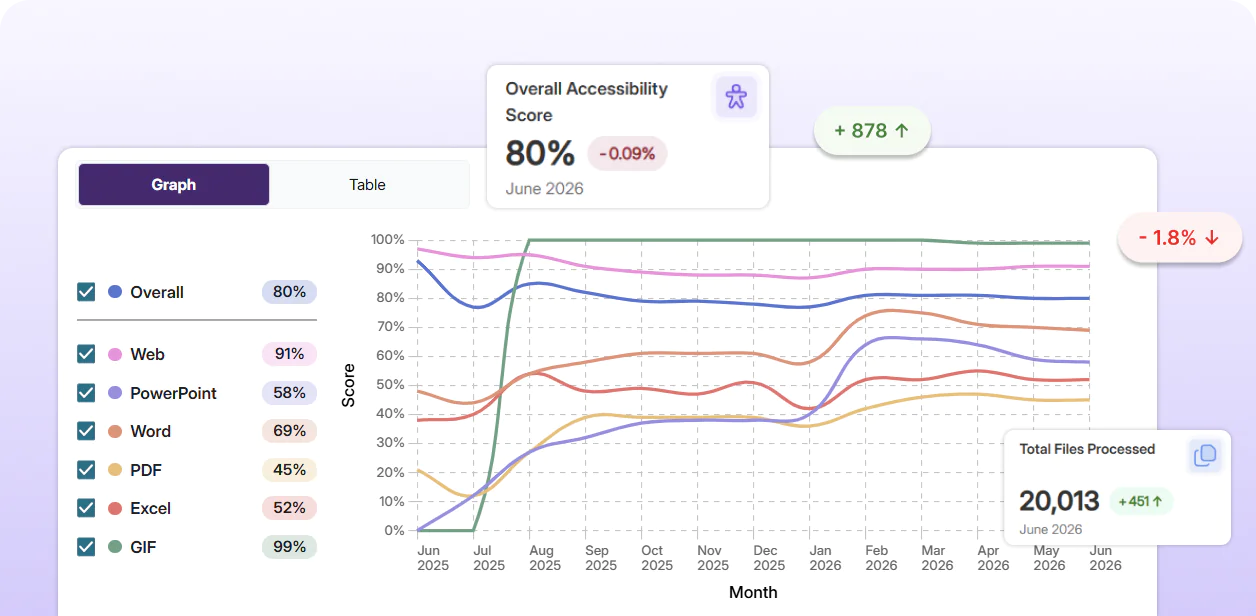
Join NowYuJa Panorama provides advanced analytics and reporting dashboards that can inform decisions and show an institution’s accessibility journey over time. Track progress across your institution and courses, then use it to inform the steps you take towards accessibility compliance.
Scrolling logos of YuJa’s clients such as SUNY Corning, University of Cambridge and University of Calgary, etc.
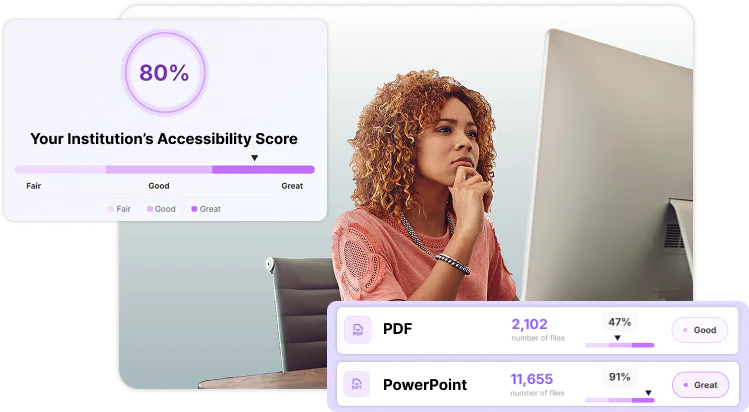
Through advanced analytics and comprehensive report dashboards, YuJa Panorama fosters the creation of accessible course content and empowers you to make informed decisions about your institution’s accessibility strategies. The platform allows you to monitor course accessibility scores, track progress over time, view insights into how students engage with materials, and pinpoint gaps in the accessibility journey.
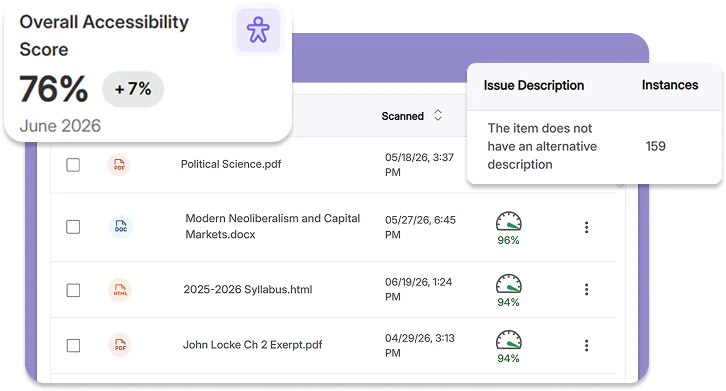
Enable your instructors to revise course content based on real-time accessibility feedback and student engagement. Use the Course Report to view an overall course accessibility score, individual-file accessibility scores, the most frequent issues that appear in course content, and the total alternative formats downloaded by students.
Use the Institution Report to track progress over time and identify the courses with the highest and lowest accessibility ratings. With monthly and term-by-term data, the Institution Report can help you optimize your institution-wide accessibility workflows.
Purdue University is leveraging the robust reporting and guided remediation features of YuJa Panorama to enhance accessibility within its online learning environment, fostering a more inclusive experience for both faculty and students across its various campuses.
Learn MoreOur LTI and native API-level integration for all major Learning Management Systems (LMS) help your instructors ensure they are providing accessible course content to their students. Instructors simply log in to their LMS and prepare their course materials. From there, YuJa Panorama seamlessly generates multiple accessible alternatives of the course-material in the background.

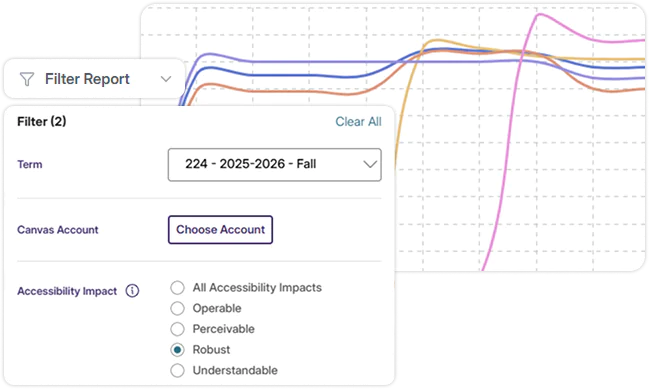
The Issues Report shows you the most prevalent accessibility concerns across your institution. View the average number of issues per document, sort concerns by their severity level, filter issues based on their accessibility impact, and export reports to help you prioritize and address the most pressing accessibility concerns in your LMS.
See how your institution measures up against others with the Comparison Report. Benchmark your average accessibility score for the past year against fully anonymized data from other institutions, providing valuable insights on institutional compliance without compromising privacy.
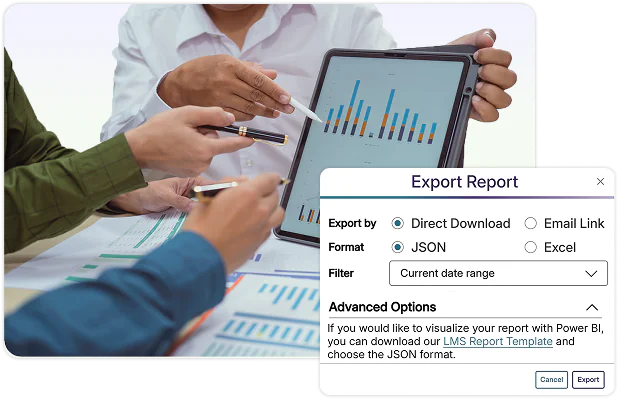
Filter and download raw report data in your preferred format to seamlessly integrate it into your enterprise reports. You can also visualize reports in Power BI using our custom-made template to instantly transform your data into actionable insights.
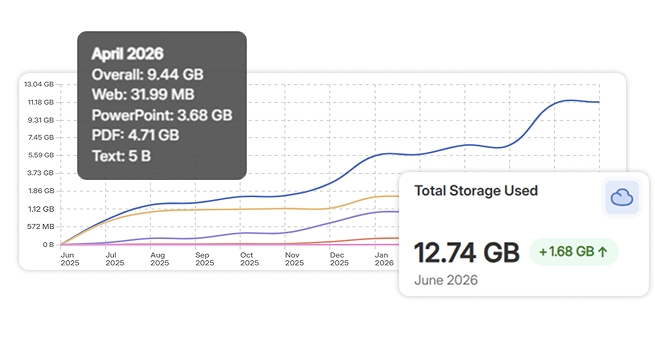
Utilize the Storage Report to maintain clear visibility into how your virtual storage is being used. Get a succinct report that outlines cumulative storage usage, number of files processed, and average file size in your LMS to proactively manage your digital data.
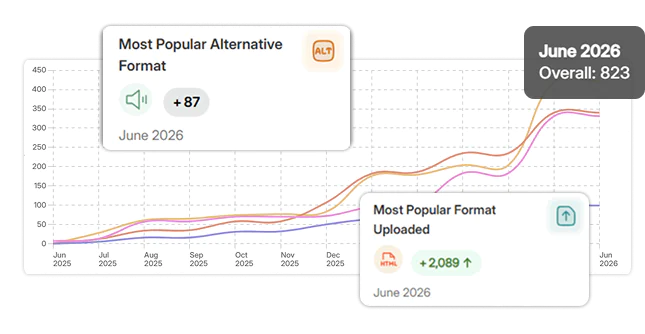
Empower instructors to create materials in the formats that matter most to students with the Content Report. Identify the most popular alternative formats used by students and the most popular upload format used by instructors to inform course-design choices.
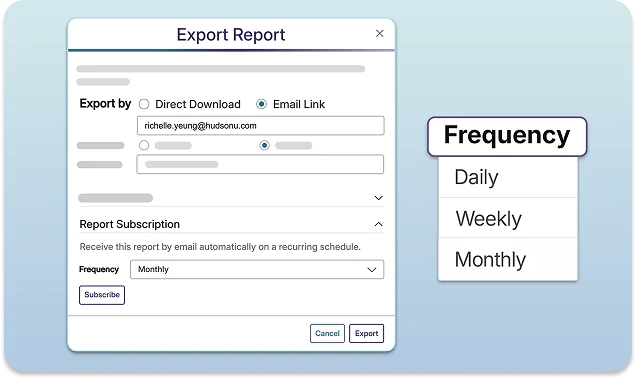
Sign up to receive periodic emails summarizing all the YuJa Panorama Reports you’ve exported in a given period, removing the need to navigate between multiple emails. Users can choose to receive emails automatically on a daily, weekly, or monthly basis.
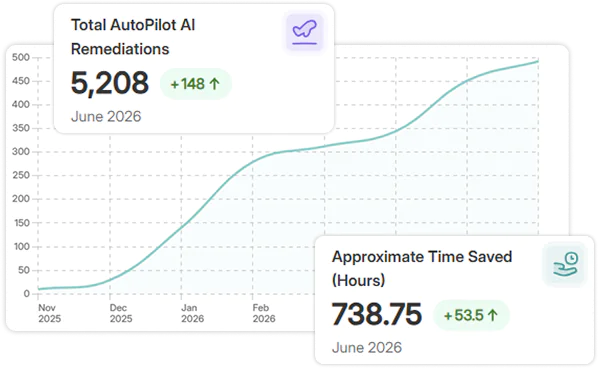
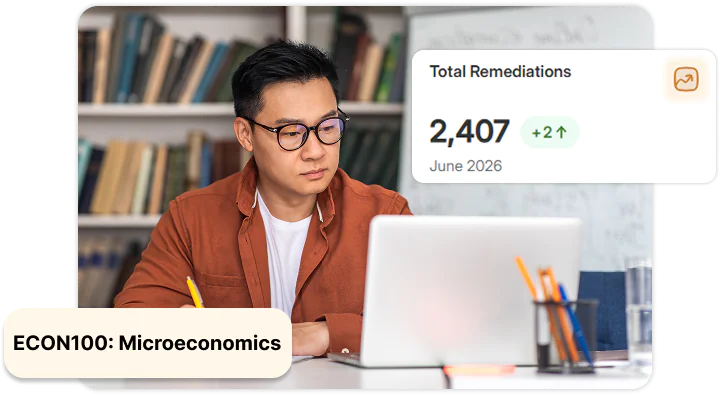
Observe how YuJa AutoPilot, YuJa Structural Remediation, and the YuJa Website Accessibility Widget are being utilized across your institution. With scorecards that automatically calculate how many hours you’ve saved and the total number of remediations you’ve performed, you can get an instant snapshot of the impact your add-ons make.
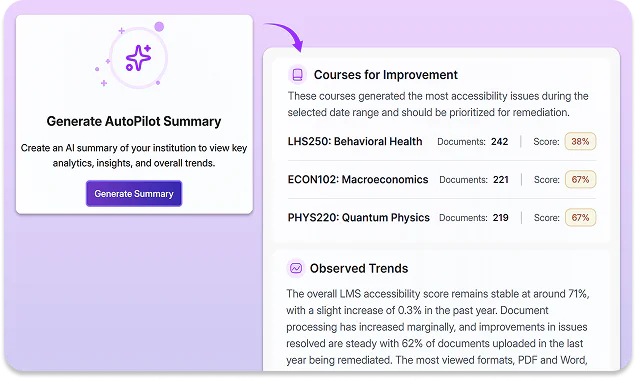
YuJa AutoPilot’s AI Summaries simplify the process of analyzing historical data. Immediately generate a clear and succinct description of observed trends, recommended areas of focus, and suggested actions to help you improve course and institution accessibility.
Join the 1,000+ Organizations Deploying High-Impact Solutions